As part of La Trobe University’s The Emerging Journalist program, the upstart team will scour all 200-plus student blogs, picking out one piece per week to publish. We’ve decided to kick things off with Jake Steven’s Round Two AFL infographic post, focused on the way margins of victory in the league are trending. It’s published below in its entirety, but be sure to check out Jake’s blog for all his work.
If Round 1 in the AFL was as thrilling as Alfred Hitchcock’s Psycho, than Round 2 was as sad as James Cameron’s Titanic. Specifically, the part where Kate Winslet decides to let Leo die, even though there was clearly enough space for two.
I am of course referring to Port Adelaide’s moving tribute to the late John McCarthy, and the displeasing and disappointing performance by the Melbourne Football Club.
Essendon’s 24 goal victory over the Demons became Melbourne’s heaviest defeat at the MCG, spanning 116 years and over 1100 games. The final margin was the 20th largest in history, and the first time the margin of 148 has been ever recorded. For Melbourne, it was their second loss in as many weeks, and is likely to foreshadow yet another unsuccessful season ahead for the struggling club.
No football fan would have enjoyed that game, showing once again, the alarming differences between the top and bottom teams. This very notion of a ‘non-competitive balance’, where results are predictable and teams get romped every weekend, gives The Boss many sleepless nights. A highly competitive league is essential for fan support, sponsorship and basically everything. That is why the Salary Cap and National Draft Priorities were introduced to even out the competition in 1987 and 1993 respectively. (Another graph on that later)
However, in 2012 the league recorded their lowest average attendance figures since 1996, a dangerous sign of the unhealthy state of competition. Many factors can contribute to this, including the introduction of GWS and the Gold Coast, as well as the premiership performance of the ‘Big Four’ Melbourne teams. Yet, the disparity of the league still remains an issue.
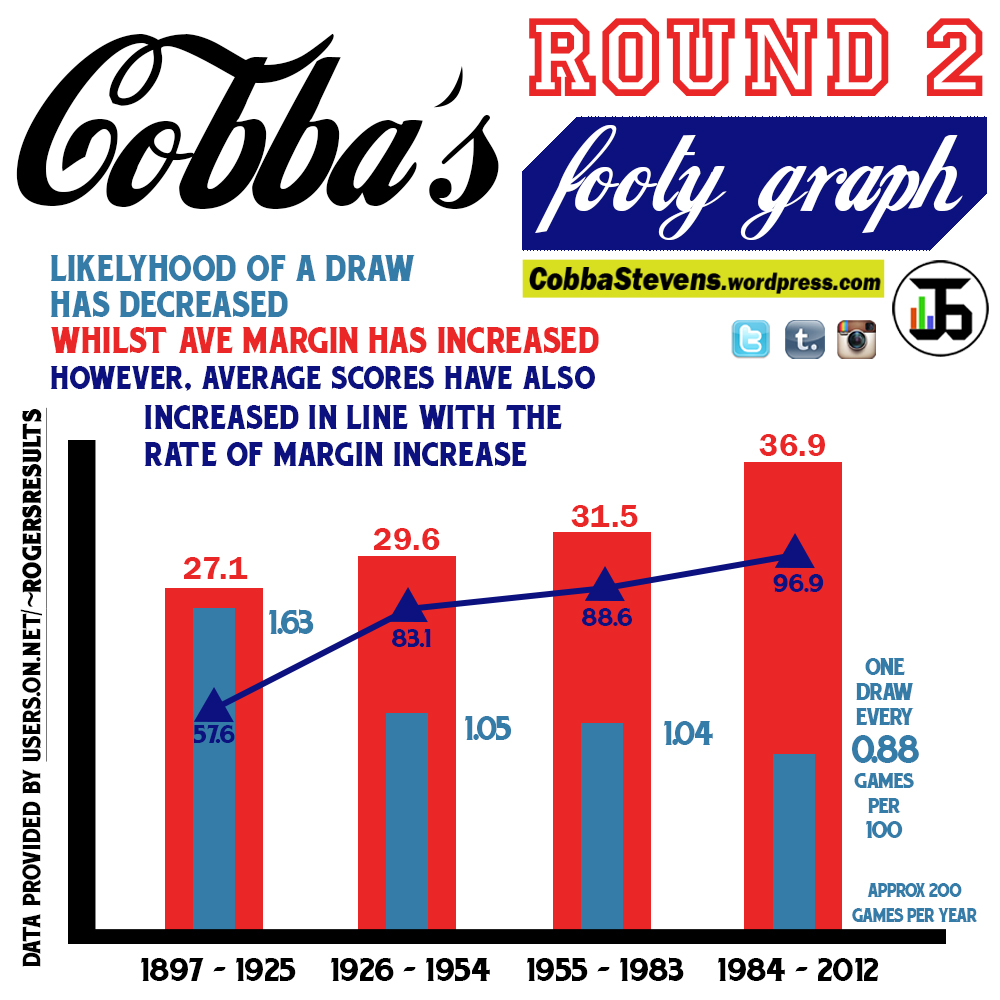
So I asked myself the question, how does today’s competition compare to previous eras in terms of close games and winning margins. Here is my findings…
You’ll notice here the likelyhood of a draw has decreased since the history of the VFL, as the average margin recorded from all games has increased. However, it is important to note that the average game score has also increased, diluting these figures.
At another time I would like to focus on the smaller picture – by analyzing the last 20-30 years of competition, to plot the direct effects of those competition stabilizers mentioned previously.
But for now, let’s all hope for a more competitive season ahead, and that this grim beginning is saved by a happy ending. Roll credits.
RIP J-Mac,
Jake Stevens is a first-year student at La Trobe University. You can follow him on Twitter: @CobbaStevens


